



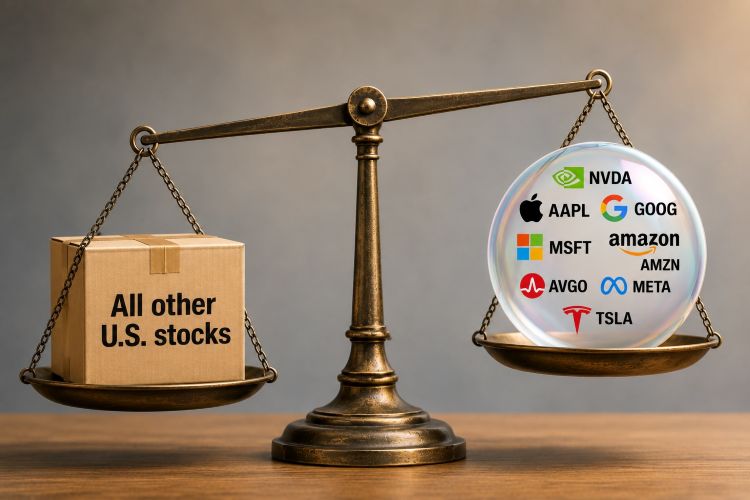
Are United States stock markets experiencing an “AI bubble” that is about to burst? Or is that theory nothing more than wishful thinking from those who missed the boat?
From late 2022 through 2026, investment in artificial intelligence by U.S. companies has increased substantially. Alphabet, Amazon, Meta, Oracle, and Microsoft have been rapidly increasing their spending, with a combined cumulative investment of $140 billion attributed to AI.[1]Productivity benchmarks continue to rise modestly – 1.9% year over year to the end of 2025 – and below the average of 2.1%.[2]This raises the question: Is AI making significant changes in productivity as it claims? If yes, then is it monetarily viable for companies to make large investments? These tensions have seen a long-standing question resurface for investors: is the current technological surge a financial bubble?
To put things in perspective, we first look at Carlota Perez’s techno-economic framework, which is highly relevant as it treats financial speculation and technological transformations not as separate processes but interconnected events.[3]
Figure 1
Perez’s studies are based on five technological breakthroughs:
- The industrial revolution
- The age of steam and railway
- The age of steel and electricity
- The age of oil
- The age of information and telecommunication
The installation phase is when new technology arrives, and the market sees a rising star, but it is still dealing with implementation challenges. The new industry brings a level of volatility to the market. The deployment phase is when the technology is implemented, and the industry has matured. Crucially, the installation period is further split in two phases: irruption, when the technology bursts onto the scene, and frenzy, when people have a fear of missing out.
The pivot between installation and deployment is what Perez calls a “turning point”.[4] At this stage, a market crash happens because the market overvalues the companies, followed by a recession. This bubble that Perez encapsulates is not an accident, but rather a recurring structural feature in which the model assumes that investors will make irrational choices based on the pattern of previous advancements.
One would reasonably assume that the U.S. market is in a “frenzy” because we are far from the irruption stage and yet to reach the turning point. This supports the notion that we are in a bubble. To further support this, we can look at two of Perez’s observations about the market, which are quite relevant for today.
First, she mentioned that each techno-boom had a “highly visible attractor” to symbolize the rising industry and its potential.[5]During the dot-com era, this could be attributed to Cisco, and the current face of AI would be ChatGPT. Second, Perez discusses that these revolutions are propelled by the product being dramatically cheaper.[6]This pattern is continued in ChatGPT and various AI models that provide a free version to all users. With AI following similar patterns, it can be inferred that a bubble may be forming as we speak.
One counterargument against Perez’s model is questioning whether we are in a real ‘frenzy’. Even though ChatGPT is the best-known AI bot, it is merely generative AI. The long-term potential of AI lies not in being able to generate information but rather in being able to replace human workers and perform complex tasks. This has led to Alphabet, Microsoft, and other large firms investing in agentic AI. This could not only boost productivity but significantly reduce costs, further increasing the earnings of these companies.[7]
While we may be in a frenzy phase for generative AI, we are yet to reach the potential of the AI industry.
The productivity puzzle
While acknowledging the potential of agentic AI growth, the heart of the case is the Solow paradox (also known as the productivity paradox), which says that even with massive investments in new technologies, the productivity gain is low. There was evidence found by the National Bureau of Economic Research, where 6,000 CEOs implemented AI and saw little impact from AI on their operations.[8]
This builds on the idea that the high level of investment by hyperscalers is not monetarily viable, and thus investors and the market are overvaluing the product because of the hype behind it. Research from Erik Brynjolfsson and others does find that AI assistance increases productivity by 15% on average across different agents.[9]Nevertheless, it was noted that less-skilled workers saw a notable increase, while the more experienced and skilled workers found a marginal improvement in speed and even a decline in the quality of output.
However, a counterargument can be drawn with the consideration of productivity lag, where companies are still adjusting to the “installation” of AI. Thus, it is premature to disregard the potential productivity boosts.
Bubble indicators and historical comparisons
To assess whether we are experiencing the same scenario seen in the past, this article examines four indicators: Shiller price/earnings, Buffett Indicator, Margin debt and S&P 500 real values, and market concentration:
The Shiller P/E ratio is the current price of an index divided by its inflation-adjusted earnings. The mean of the Shiller P/E ratio is 17.38, and the highest value of 44.19 was reached during the dot-com bubble.[10]The current value of 41.57 is extremely close to the historical maximum, indicating that the US market is overpriced.
Shiller PE
Figure 2[11]
Buffett Indicator
The Buffett Indicator was popularized by Warren Buffett in the early 2000s to gauge the overall valuation of the stock market. It compares total stock market capitalization to GDP. A reading between 75% and 90% is considered normal, while a reading above 120% suggests the market may be overvalued.[13]As of June 2026, the U.S Buffett Indicator is around 231.75%, meaning the stock market is more than twice the size of the U.S. economy. This is far higher than the peak value in 2000s, where the Buffett indicator was 147.48%.[14]

Figure 3[12]
Margin debt and S&P 500 real values
From Figure 4, there are four noticeable points where the gap between margin debt and S&P 500 appears significantly higher than their respective linear counterparts: 2000, 2007, 2021, and the present in 2026. All three previous cases show these peaks were followed by a recession. These periods shared similar characteristics: margin debt rising sharply, exceeding the S&P 500, and being above their long-term trend line.

Figure 4[15]
A similar pattern has appeared recently, in which margin debt has surpassed S&P 500, and both of those values are far higher than their linear counterpart. This does not tell when the crash happens, but rather that the high leverage in the market could lead to rapid downturn if investor sentiment weakens.
Market concentration
An unprecedented event is happening, where the structure of the market is more concentrated toward the top 10, with most of them aggressively investing in AI. As per Figure 5, we can see that the concentration of S&P 500 dramatically increased from 28.6% to 40.7%.[16]]

Figure 5[17]
By every aggregate measure of market valuation, the U.S. equity market is now priced at levels consistent with the final phase of prior speculative cycles. The structural issue of the top 10 companies having a concentration of 40.7%, will contribute to a more fragile market environment.
In isolation, the indicators may not be sufficient to draw a conclusion, but, taken together, it implies that downside risk is increasingly asymmetric.
It is important to acknowledge that each indicator has limitations. For instance, the Buffett Indicator is potentially distorted by multinationals earning revenue from overseas, and the Shiller P/E can stay elevated for a long time before correction takes place. Furthermore, this does not mean a market crash is happening tomorrow, as these elevated values can stay persistent for a long period of time.
Does valuation justify the price to a degree?
Every capital cycle of sufficient size is compared to the dot-com mania in the late 1990s. The comparison is reflexive, as many indicators, shown above, on the surface are matching, where a small group of firms are dominating, the prices are rapidly rising, and capital expenditure (capex) growth is astronomical. However, the bubble question is not answered by spending only, but whether these investments are producing or will produce fruitful results.
Understanding whether companies have a justifiable market price is subjective to a degree. However, we can draw comparisons between Cisco’s historical valuation and those of companies such as NVIDIA, Micron, and AMD, which are among the most well-known chip producers. The reason 1999–2000 is the right comparison period, rather than the 2008 financial crisis, or the railway boom, is that it was the last technology and equity mania of comparable scale concentrated in a small group of dominant suppliers.
Cisco Systems will be the central point of comparison. This company was the backbone of the internet era, but the expectations put on the company were unprecedented. A 200 PE implies that the market was willing to pay 200 times the earnings of Cisco at the time.[18] [10] For this to be well-priced, the company would need to have extraordinary returns for multiple years.

From the table, NVDA’s valuation metrics act as the clear counterargument to the bubble argument, where both P/E and price-to-earnings/growth (PEG) ratios are significantly lower than CISCO’s values, while the revenue growth and earnings before interest, tax, depreciation, and amortization (EBITDA) margins are significantly higher.[19][20]
Micron reinforces this point, with its P/E and PEG, and is better than CISCO.[21] However, Advanced Micro Devices (AMD) presents a different narrative where the P/E is 162, and the PEG is 5.23, implying that it is reaching the values of CISCO.[22]The 34.34% revenue growth and 30.97% EBITDA growth confirm that the business is moving in the right direction, but the market is overvaluing the stock in terms of price, focusing on the optimistic future potential.[23]
Taken together, the table suggests that not every major semiconductor stock is conservatively priced or overvalued. While NVDA and Micron are more defensible relative to their growth and price, AMD is seemingly closer to the values of Cisco in 1999, showing that we are potentially in a growing bubble, rather than the peak of a bubble.
This analysis favours the notion that the U.S. market is facing a bubble. The aggregate indicators show similar signs to previous bubbles, along with new structural cracks in increased concentration of top 10 U.S. stocks in S&P 500. However, with the potential of agentic AI and the fact that some stocks, including NVDA, are not as overvalued as CISCO was during the dot-com bubble, creates uncertainty about whether the current market is indeed a bubble.
Sources
[1] Juniewicz, I. (2026, February 26). Hyperscaler capex has quadrupled since GPT-4’s release. Epoch AI.
[2] Reid, M., et al. (2026, April 22). Measuring productivity: How it impacts the U.S. economy. RBC Economics.
[3] Perez, C. (2002). Technological revolutions and financial capital: The dynamics of bubbles and golden ages. Edward Elgar Publishing.
[4] Perez, C. (2002). Technological revolutions and financial capital: The dynamics of bubbles and golden ages. Edward Elgar Publishing.
[5] Perez, C. (2002). Technological revolutions and financial capital: The dynamics of bubbles and golden ages. Edward Elgar Publishing.
[6] Perez, C. (2002). Technological revolutions and financial capital: The dynamics of bubbles and golden ages. Edward Elgar Publishing.
[7] Vantage Market Research. (2026, June 1). Global agentic AI market to surge from USD 10.21 billion in 2026 to USD 388.30 billion by 2036, growing at a CAGR of 43.80%.
[8] Yotzov, I., Barrero, J. M., Bloom, N., Bunn, P., Davis, S. J., Foster, K. M., Jalca, A., Meyer, B. H., Mizen, P., Navarrete, M. A., Smietanka, P., Thwaites, G., & Wang, B. Z. (2026). Firm data on AI (NBER Working Paper No. 34836). National Bureau of Economic Research.
[9] Brynjolfsson, E., Li, D., & Raymond, L. (2025). Generative AI at work. The Quarterly Journal of Economics, 140(2), 889–942.
[10] Multipl.com. (2019). Retrieved June 7, 2026, from Shiller PE ratio.
[11] Multipl.com. (2019). Retrieved June 7, 2026, from Shiller PE ratio.
[12] MacroMicro.(n.d.). Retrieved June 6, 2026, from US – Buffett indicator.
[13] MacroMicro.(n.d.). Retrieved June 6, 2026, from US – Buffett indicator.
[14] MacroMicro.(n.d.). Retrieved June 6, 2026, from US – Buffett indicator.
[15] Nash, J. (2026, May 20). Margin debt up 6.8% in April to a record high. Advisor Perspectives.
[16] Frawley, T. (2026, January 23). The “great narrowing”: S&P 500 concentration. RBC Wealth Management.
[17] Frawley, T. (2026, January 23). The “great narrowing”: S&P 500 concentration. RBC Wealth Management.
[18] LSEG Workspace. (2026). Cisco Systems, Inc. (CSCO): Annual income statement, fiscal years 1997–2002 [Data set]. London Stock Exchange Group (Refinitiv).
[19] LSEG Workspace. (2026). Cisco Systems, Inc. (CSCO): Annual income statement, fiscal years 1997–2002 [Data set]. London Stock Exchange Group (Refinitiv).
[20] Investing.com. (n.d.). Retrieved June 7, 2026, from NASDAQ:NVDA financials | NVIDIA Corporation.
[21] Investing.com. (n.d.). Retrieved June 7, 2026, from NASDAQ:MU financials | Micron Technology.
[22] Investing.com. (n.d.). Retrieved June 7, 2026, from NASDAQ:AMD financials | Advanced Micro Devices.
[23] Investing.com. (n.d.). Retrieved June 7, 2026, from NASDAQ:AMD financials | Advanced Micro Devices.
(Aarav Bhatia – BIG Media Ltd., 2026)